Wanted an easy way to visualize the clustering of a website?
It’s difficult to communicate the structure of SEO focused clustering to teams, stakeholders, and clients because these mappings are often presented as spreadsheets.
This free cluster visualizer that I built fixes the problem!
It allows you to upload a spreadsheet of your keyword research or cluster mapping and get a nice visualization in seconds.
About the cluster visuals:
- Parent clusters = big bubbles
- Subclusters = smaller bubbles
- Nodes = pages
- Bubbles are sized based on search volume
- Hover over each bubble to get total search volume
- Hover over a page node to get URL and search volume
- Click on bubbles to open/hide their child bubbles/nodes
- Use your mouse wheel to zoom in and out
- Click and drag to move around
- If a page is new, it glows green!
- Reload the page to reset the bubbles
Screaming Frog’s visualization tool is pretty good but it only works for existing pages and requires a lot of customization to import a visualization of non-existing pages.
This free cluster visualizer is easy to set up and use.
How to create a cluster visualization
You will need to create a spreadsheet with this exact format for it to work.
Download the format template here
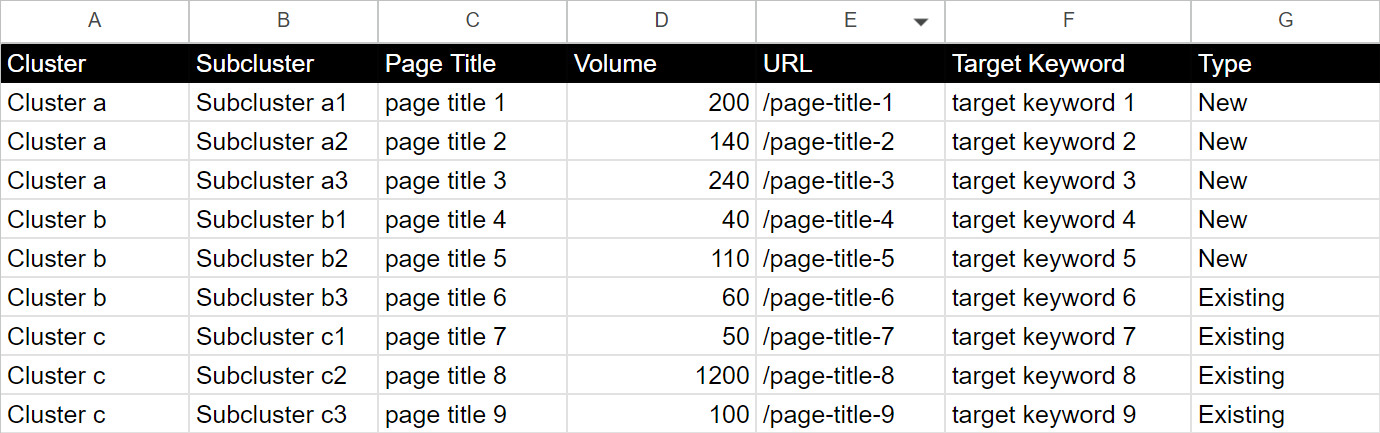
Once you format your data into a nicely nested clustering like the sheet above, you simply download it as a csv.
Upload your CSV by selecting “Choose File” and then click “Upload”.
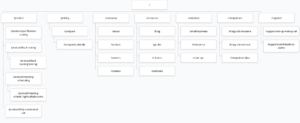
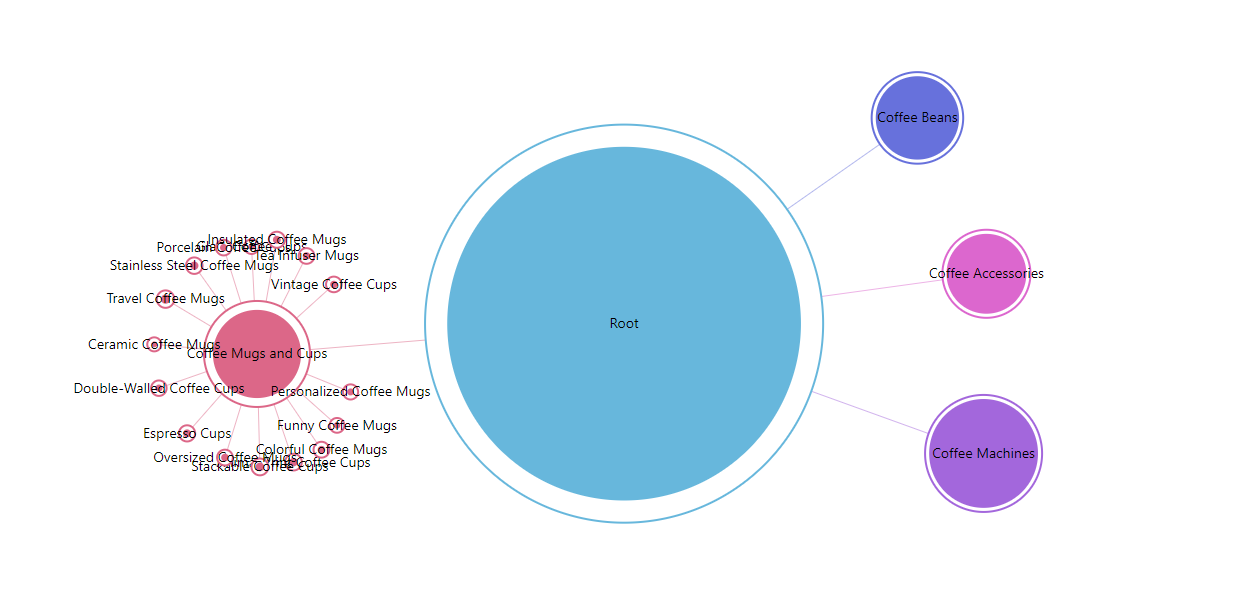
Then you should see a nice visualization like this!
How to use the cluster visualization
This website bubble chart is a force directed tree diagram made with AmCharts. It brings keyword/clustering spreadsheets to life in a fun and interactive way.
Use your visualized representation of website structure to:
- Impress your boss by making it easy to see and understand what you want to do
- Present your cluster mapping to clients in a visual way and get your project approved faster
- Improve your clustering setup by visually refining and troubleshooting your structure
Download example demo data
Want to try it out on a demo site? Download this sheet as a CSV and upload it to the visualizer.
Try it out
- Download my sample data for a coffee website to get an idea of what is possible with the cluster visualizer.
- Upload as CSV to clusters.jonathanboshoff.com and try the interactive demo for yourself.
Connect with me on LinkedIn or Contact me any time and share your thoughts.
P.S. Don’t forget to join my newsletter.