Note: This guide was originally created for Universal Analytics. Check out this guide for GA4.
Users exit your online store at every stage in your checkout process. Often at alarming rates. Studies have shown that the average cart abandonment rate for an Ecommerce store is 69.80%.
Today I’m going to show you how to get a great visualization of how users proceed through each step on your website, how to identify problem areas, and how to decrease drop-off rates. This will also help you set benchmarks to improve on.
Meet the Shopping Behavior Analysis report
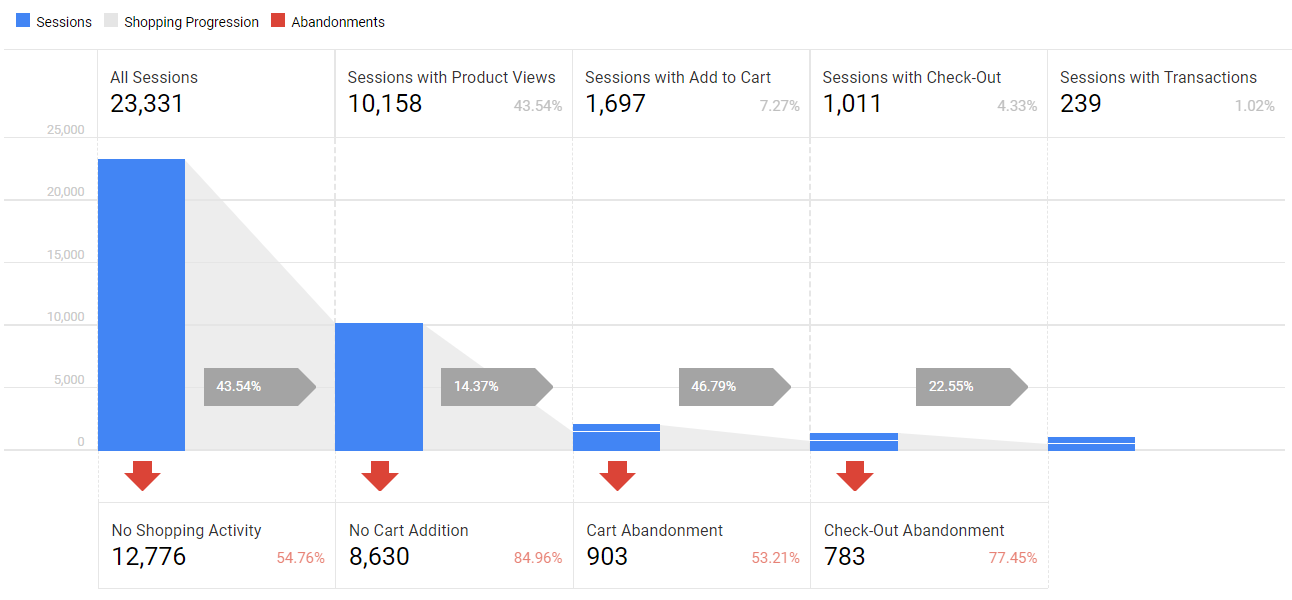
The image above is a Shopping Behavior Analysis report found in Google Analytics. If you have Google Analytics set up as well as enhanced Ecommerce enabled, you’ll be able to access this report and all the highly valuable data that comes with it. If you don’t have that set up already, here’s a great guide on installing Google Analytics, and here’s a great guide on setting up enhanced Ecommerce in your account. If you’re just setting it up, you will need to collect some data before you can get accurate results.
Let’s look at how we can leverage this report and decrease drop-off rates:
1. Access the Shopping Behavior report:
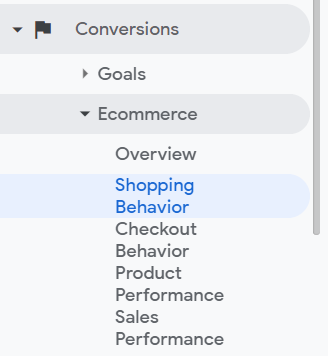
This report is a hidden gem in Google Analytics, it’s tucked away in Conversions > Ecommerce > Shopping behavior. Be sure to set your date range to ensure you’re getting an accurate view of your data. I’d recommend going to a 90+ day view for your first glance.
2. Analyze drop-off points in your shopping & checkout funnel
Reviewing this report can be quite an eye-opening experience and it only takes a few minutes to understand it. The first part with the grey arrows and blue bars shows you percentages of how many people are successfully moving through each stage in your checkout process. From shopping to adding to cart and then checking out.
Shopping progression:
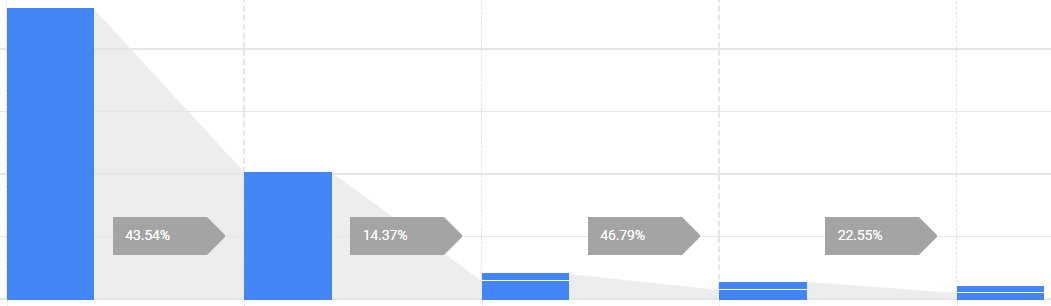
In this example, 43.54% of people who visited the website viewed a product, 14.37% of people who viewed a product added it to their cart, 46.79% of people who added a product to the cart went to check out, and 22.55% of people who went to checkout successfully completed a transaction. These numbers may surprise you. Your numbers may surprise you too, it’s definitely worth reviewing this report frequently.
Abandonments:
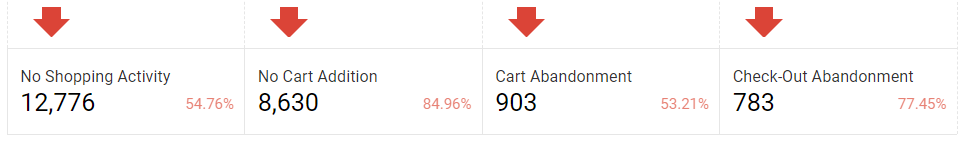
The second part below the blue bars shows your drop-off points in red. In my example, I see that more than half of the website visitors don’t view any products. I’m also surprised that 77% of people who are on the checkout page aren’t buying. The insights you find from this report quickly and effectively highlight problem areas in your checkout funnel.
3. Prioritize shopping stages to improve on
In my example, I’ve determined the big things to focus on are decreasing checkout abandonment as well as increasing the number of people who view product pages. Next, I would review both of these stages and come up with some ideas for why people aren’t moving forward in these stages. In this store’s case, one of the big factors causing check-out abandonment is high and unexpected shipping costs. I also think that the home page is where I’ll be able to increase shopping activity the most. Once I review problem areas and have a few ideas of what might be causing drop-offs, I’ll come up with ideas to test and prioritize them based on which ones I think will make the biggest impact.
4. Test and optimize high drop-off areas in your Checkout Funnel
Now that you know which areas of your Ecommerce check-out funnel are causing drop-offs and not performing well, you’ll be able to start optimizing these areas and testing improvements. I do this by setting up split tests (A/B tests), as well as implementing best practices like Core Web Vitals optimization. Not all things can be A/B tested. In this example, I may just want to look for a way to reduce shipping costs or offer free shipping over a certain dollar amount or come up with another way to offer free shipping.
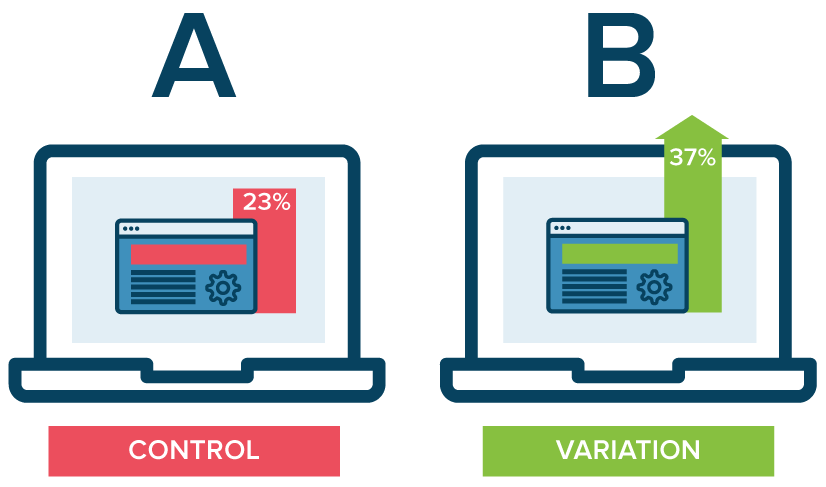
A/B Split Tests
For pretty much any situation where the outcome isn’t certain, I like to run a split test. When I run a split test I try to only change one key element at a time. Otherwise, I’ll never know for sure which changes made an impact and how much impact each change made. The trick is to balance high-impact tests vs minimal changes. If you tweak minor elements of a page, you’ll get minor results.
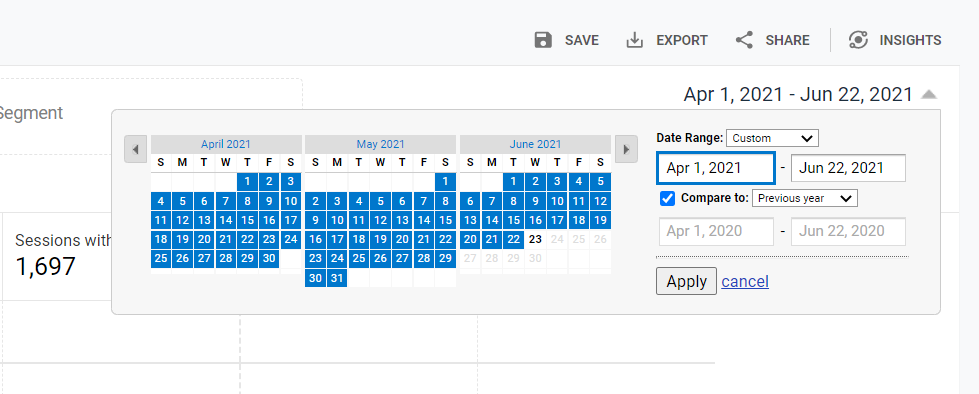
5. Compare check-out process to previous periods
Want to compare your checkout process this year, quarter, month, week, or even day? It’s easy with Google Analytics. Simply select the “Compare to” checkbox and select previous month, previous year, or custom.
Try comparing last month to last year, or the month before that. Check to see your quarterly year-over-year performance.
Have you made changes to your website lately? Compare date ranges to see what kind of an impact it made on your checkout process.
6. Segment Shopping Behavior data
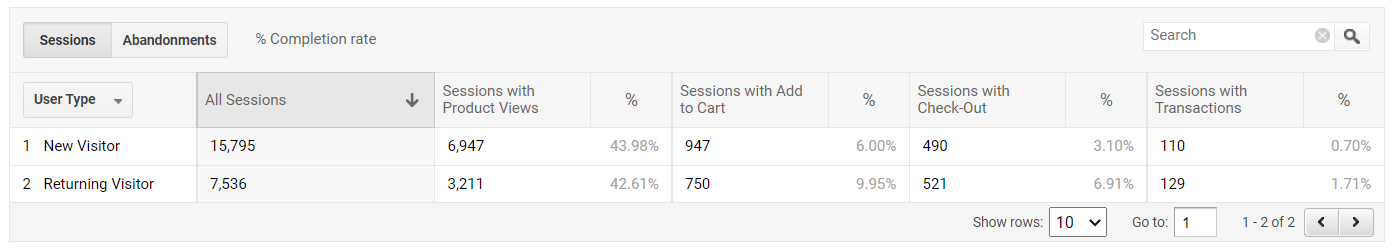
You can also segment your data with a predefined or custom segment. For example, mobile viewers. This allows you to compare things like mobile performance vs desktop performance. The bottom of this report also has a table for analyzing sessions and abandonments based on a segment, so you can double segment your data in this report.
Some segmentation ideas:
- New vs returning mobile visitors
- Performance by source
- Abandonments by device category
Final thoughts:
The Shopping Behavior Analysis report is underutilized and is an insanely useful tool. I recommend reviewing it monthly, quarterly, yearly, and whenever you make big changes to your website. If you haven’t taken the time to set this up yet, it’s well worth the effort.